


Market Data
This note aims to arrive at a standardized taxonomy for market risk data to better communicate information around recent regulatory guidance for market risk management and capital charge computation. We aim to build a common nomenclature to be used between management, analytics teams, and the IT departments deriving from the regulatory deï¬nitions.
Market data includes the prices, rates, or quotes of traded instruments in the marketplace (exchange-traded instrument - cleared through CCP, or bilateral trades through the OTC mechanism). Examples include swap rates term structures, rate indices (SOFR, EONIA rates, CDS spreads, commodity prices, volatility quotes, and futures prices.
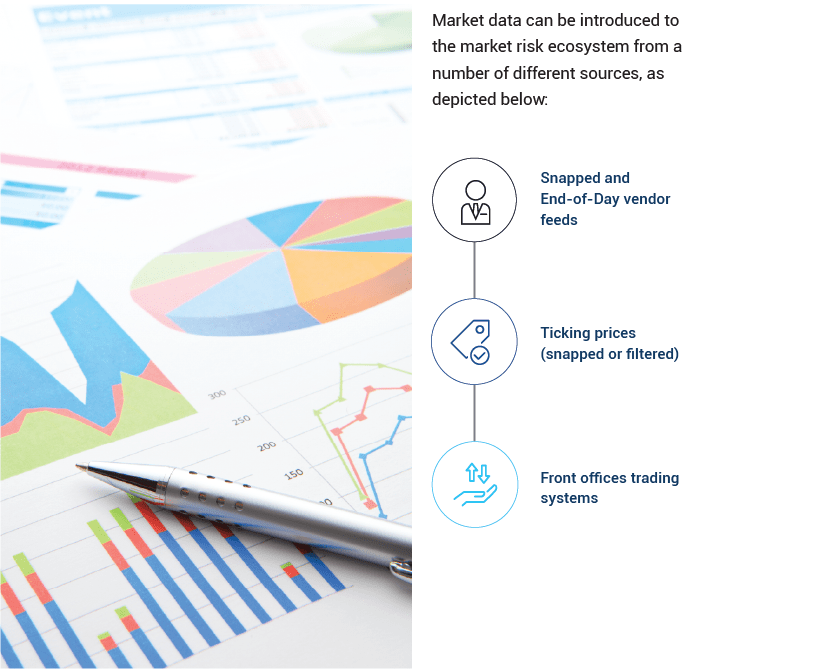

Position and Transaction (P&T) data will be introduced to the market risk ecosystem from the bank's front office, and risk and finance systems. This is internal proprietary data. Other banks will not and should not be aware of the positions/trades the bank is running. For the purpose of this document, "P&T data" shall be a generic term that shall cover the following categories of internal data:

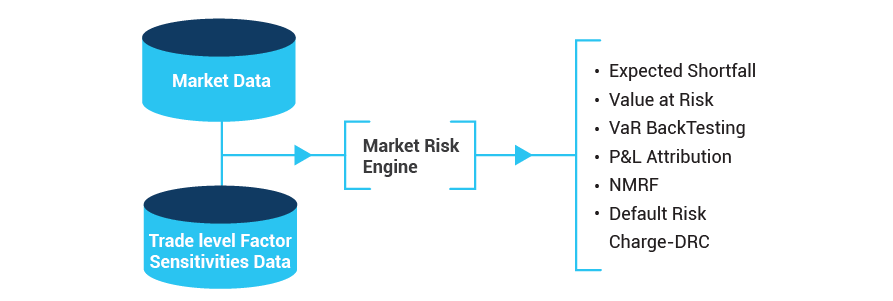
The inputs, processes and outputs used to generate market risk matrices are illustrated below
Market Risk System Data Flow Structure

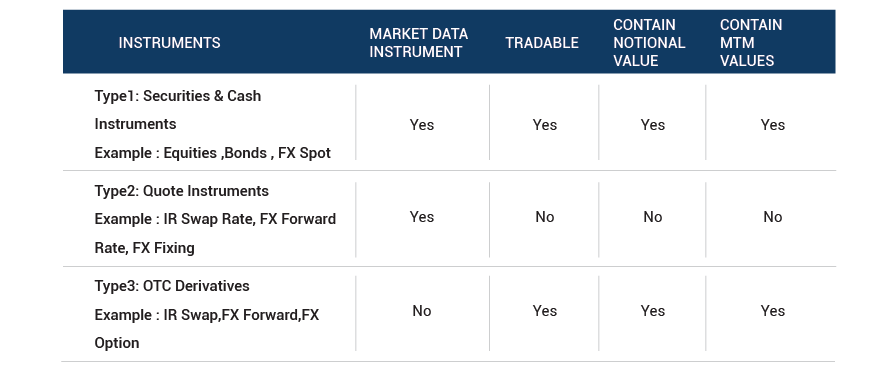
Three basic categories of instruments can be defined with respect to market data:
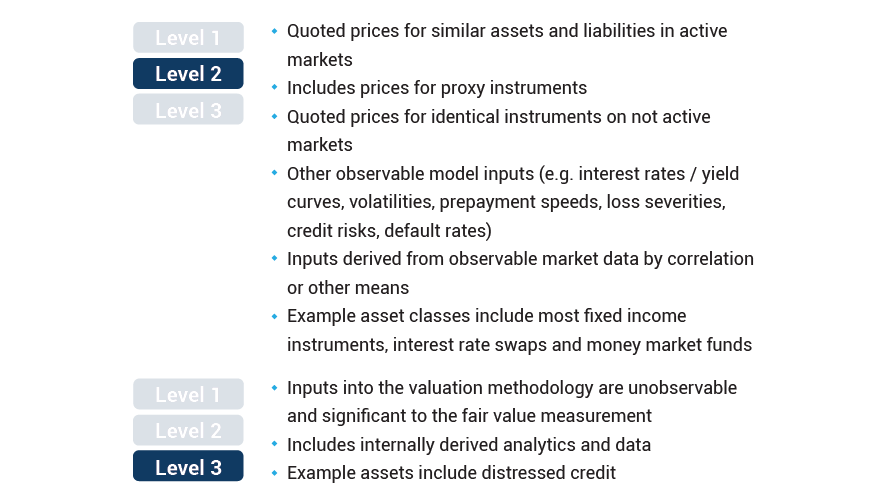
Such an asset classification is a significant first step in shedding light on market data quality and issues regarding market risk, P&L and valuation risk. However, as workflows continue to evolve significantly beyond simple classification, a three level classification of market data as per the below table is warranted:

Data Lineage Problems
In the sub-section “Instruments and Market data” above, three categories of instrument identifiers were introduced:
This section describes some instrument lineage requirements using a Type 3 instrument identifier example. Type 3 instrument identifiers are identifiers for OTC derivatives.
Some important features of OTC instruments are:
Lineage from the OTC instrument identifier to related Type 1 and Type 2 instruments as well as source data should be maintained at all times.
Instead of a single price, an OTC derivative typically has multiple risk factors, each of which has a price. And even though the OTC has multiple risk factors, it has only one MTM value, and an MTM value is not a price.The MTM value (or PV) is instead a dollar amount equal to the present value of the future cash flows of the OTC.
To calculate the PV of OTC derivatives a pricing model is required. The model takes each risk factor as an input and revalues the MTM each day. The following is an example:
Type 3 instrument
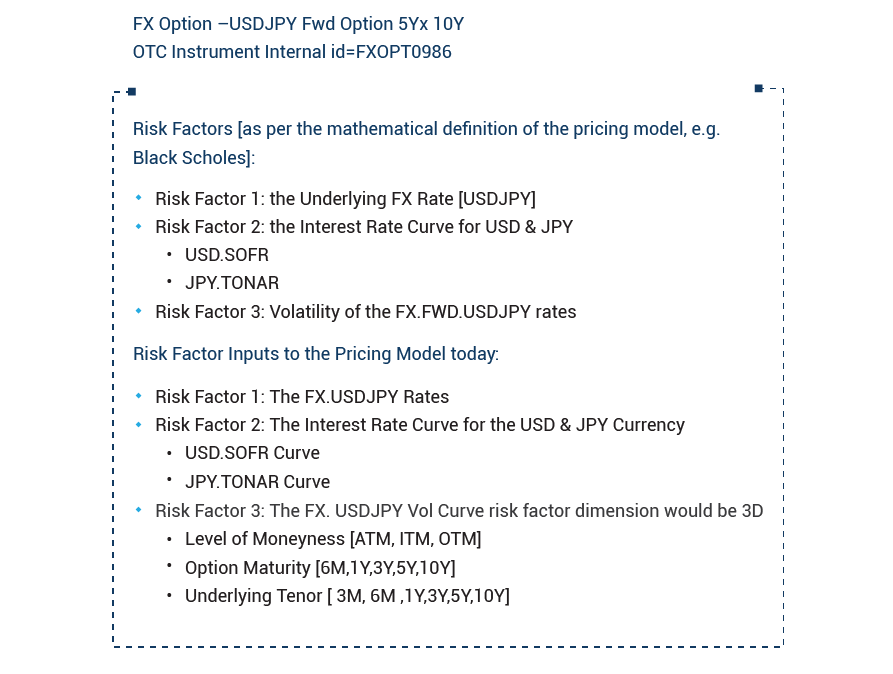
The Total RFs required to perform Vega calculation would be = 3 Level of Moneyness x 6 underlying Tenor x 5 Option Maturity = 90 RFs
Data lineage is critical for effectively defining market risk factors and its utility in regulatory capital calculation [eg FRTB] that has to comply with ECB /TRIM/FED guidelines on effective model risk management [MRM].
The ability to trace the model inputs back to source and with a full audit trail of the various transformations that have been applied (derivations, calibrations, golden price rules, etc.), is seen as critical by auditors and regulators alike. Some of the key aspects of data lineage for model risk management are

For the risk factors identification process to be compliant as per the FRTB regulation, the FRTB regulation requires each risk factor to be mapped to a regulatory risk class, risk factors-RFs category and liquidity horizon of RFs.
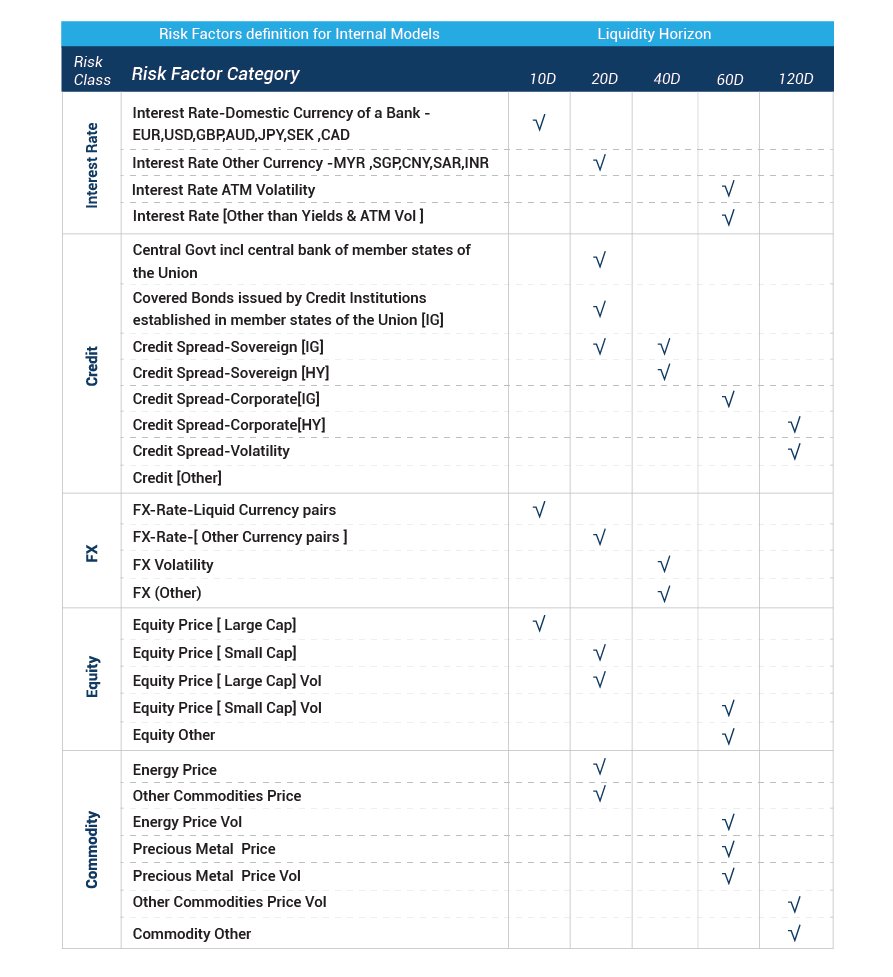
Let’s take a real example to understand how we can define and retrieve risk factors from trading book portfolio.
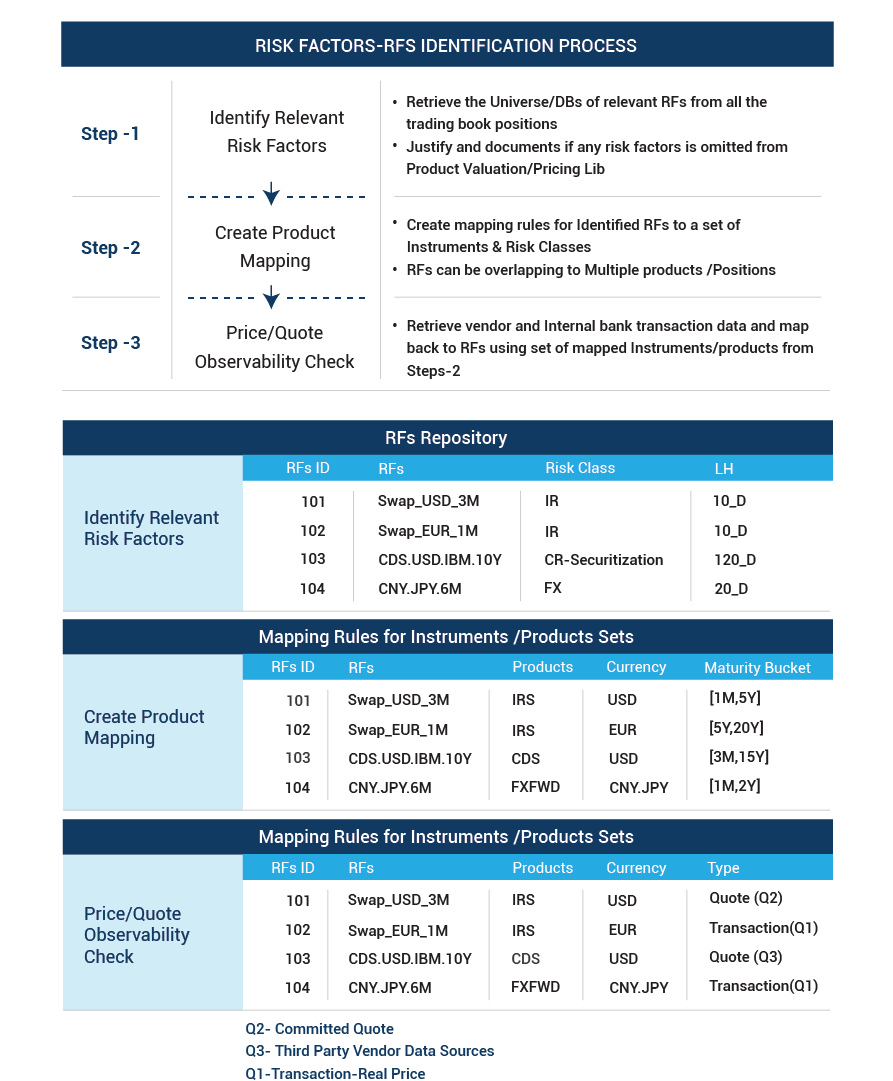

RFs can be defined as "a principal determinant (PCA) of the change in value of a transaction” that is used for the quantification of risk.
Interest Rate Risk Factors
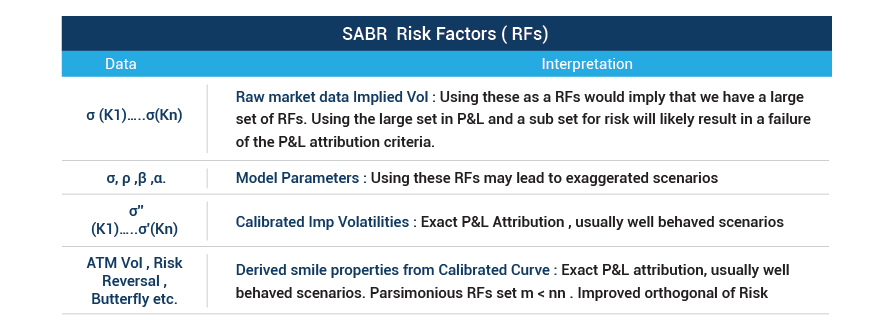
Volatility Surface Risk Factors

Calibration of SABR model
For each option maturity and underlying, we have to specify 4 model parameters σ, ρ, β, α. Market implied volatilities for several different strikes are needed for the same. Given this, the calibration poses no problem. For example, one can use the excel solver ability.

Inputs Imp Vol for several different strikes
Calibration results show an interesting term structure of the model parameters. An example for these model parameters may be the parameters of a displaced SABR model σ, ρ, β, α.
Non Modellable Risk Factor (NMRF)
NMRF analysis is multi-faceted. The analysis includes:
Criteria for real price determination
An executed trade is clear evidence of a real price. There isn’t really a lot of room for interpretation there. The size of the trade and the potential for collusion between trade counterparties to create a trade that will support a regulatory capital target are two potential exceptions to this. But there are not many. With committed quotes, however, things are less clear. Some or all of the criteria below should be taken into account to identify committed (executable) quotes:

Don't miss this roundup of our newest and most distinctive insights
Subscribe to our insights to get them delivered directly to your inbox